
Attaching a Graph
Sales Analysis provides graphing capabilities for data queries. You can create graphs and save them for each summary level for each query.
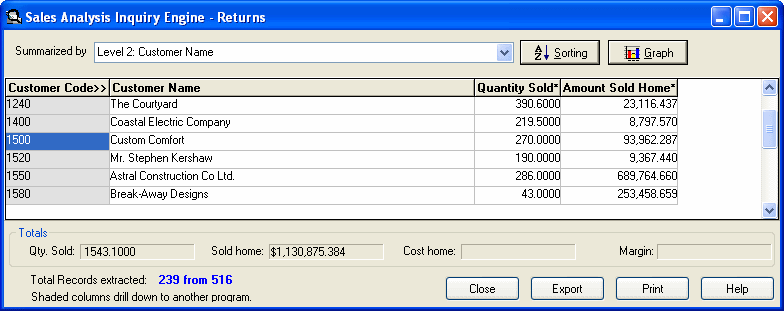
Click on the Graph button on the Query results screen to open the Chart display.
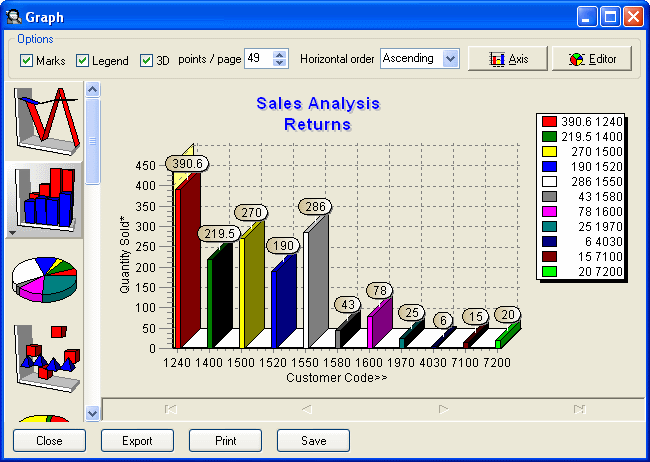
The Chart display will default to the most recent Chart type, unless a chart type and settings have been saved for this query and summary level.
Click on a Chart type to change the Chart display for this query and summary level.
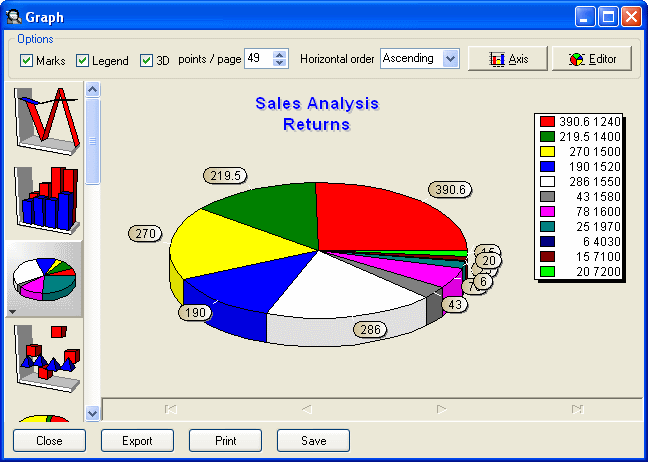
Additional display options may be changed using the Editor Button on the chart. Use the Help button on the Editor screen for more specific information on this feature.
Charts may also be copied to the Clipboard for use in other programs. Click on the Export button to copy a chart.
Charts may be sent by email or saved to other locations, as graphic files. These options are also available on the Export button.
Be sure to save the query in the Inquiry and Report Engine when satisfied with the display of data in the query and charts.